Abstract: Companies which provide public transportation services should get motivation to improve the quality of their services while decreasing the costs. Primary aim of the current research is to carry out investigation into quality of transportation system in Bukhara – one of the most important cities in Uzbekistan in terms of being historical and cultural place, thus attracting more tourists. The methodology followed by this research is to use qualitative study which has been done based on the survey and quantitative study which was based on the results obtained from a particular group. Students who made the representation of sample were the major users of bus. Some of the factors which have huge impact on the overall satisfaction level are: controller behavior, technology, drivers behavior, convenience, amenities and finally the price. Generally, students feel dissatisfied with the public transportation quality. While technology is most welcomed factor, convenience is the last to be appreciated. By taking the results into account, the current study will try to come up with some innovative approaches to improve the efficiency and quality of public transportation in the city.
Keywords: regression analysis, satisfaction, exploratory factor analysis, qualitative analysis, public transportation.
JEL: R41
SPÔSOBY ZVYŠOVANIA KVALITY PREPRAVNÝCH SLUŽIEB
Abstrakt: Spoločnosti poskytujúce služby verejnej dopravy by mali dostať motiváciu zvyšovať kvalitu svojich služieb pri znižovaní nákladov. Primárnym cieľom súčasného výskumu je vykonať prieskum kvality dopravného systému v Buchare – jednom z najvýznamnejších miest v Uzbekistane z hľadiska historického a kultúrneho miesta, čím priláka viac turistov. Metodológiou tohto výskumu je použitie kvalitatívnej štúdie, ktorá bola vykonaná na základe prieskumu a kvantitatívnej štúdie, ktorá bola založená na výsledkoch získaných od konkrétnej skupiny. Študenti, ktorí reprezentovali vzorku, boli hlavnými používateľmi autobusu. Niektoré z faktorov, ktoré majú obrovský vplyv na celkovú úroveň spokojnosti, sú: správanie respondentov, technológia, správanie vodičov, pohodlie, vybavenie a nakoniec cena. Vo všeobecnosti sa študenti cítia nespokojní s kvalitou verejnej dopravy. Zatiaľ čo technológia je najviac vítaným faktorom, pohodlie je to posledné, čo treba oceniť. Zohľadnením výsledkov sa súčasná štúdia pokúsi prísť s niektorými inovatívnymi prístupmi na zlepšenie efektívnosti a kvality verejnej dopravy v meste.
Kľúčové slová: regresná analýza, spokojnosť, prieskumná faktorová analýza, kvalitatívna analýza, verejná doprava.
1 Introduction
It is always considered vital to have enough information regarding transportation quality provided in countries since it is regarded as a driving force and catalyst for economical development [1].The overall customer perception regarding an experience of making use of services is what is considered to be quality in the literatures [2]. There is a bunch of tools to acquire user expectations and experiences when carrying out qualitative analysis. Having said that, SERVQUAL stands out among many others by being commonly used and known tool to measure quality of services [3]. This tool is believed to be a multi-dimensional instrument used when carrying out research which is designed to clearly determine what the consumer perceptions and expectations are for a given service. This measurement tool has scale which comes in handy when making measurement of customer perception and expectations regarding performance of received service. The service quality can be measured by scale which has five dimensions which are: responsiveness, empathy, tangibility, reliability and assurance. Meeting the customer needs should be the primary role for transport services and due to the specific services, customers usually do not have many other viable options to pick from. Since the quality cannot be overlooked, to respect the user expectations who use public transport, quality should be the main focus for companies which are held responsible in terms of delivery of services [4]. The quality of provided public transportation service in Bukhara started getting regarded as a vital focus for the administration which is in charge of public transportation.
Initially in a local scope, the city administration came up with the idea of modernizing transport network, specifically the network of buses. As a part of this initial step, new facilities and new buses came to the view in the city. One example of particular things which are to be introduced is the appearance of displays with announcements and commercials in bus stations and buses. Since the students are the major users of the public transportation, they were targeted in order to collect statistical data which is the most important part in this work.
2 Assessment of transportation quality – literature review
Services related to public transportation are considered as a transportation via conveyance which make provision of specific or general transportation to users [5]. There a quite a few studies carried out to make assessment of public transportation system, most of which with the focus on the buses. Most studies approach quality of this particular type of service in certain geographical areas.
In the year of 1998, Edvardsson.Bo carried out research into causes of dissatisfaction among customers by taking the events into consideration which cause the users to complain about the current state of the service. Interviews were organized and written complaints were collected to make analysis. What was concluded from that study was that all the sources of dissatisfaction were happening over and over again in the area where the research was conducted and besides, the factors which were lowering the quality of transportation were punctuality and drivers impoliteness [6]. Research carried out by Kumarv Kanagaluru Sai [1] makes the gap obvious between passenger perception and expectations. Besides, the researcher developed this research further to study the difference among different respondents such as women, men and other passengers who have various occupations.
The research, which was carried out by Sanchez Pérez, Manuel et all [7] investigated the connection between purchase intention and quality of service in public transportation service in Spain by applying SERVPERF adapted scale. Following this is a new scale called QUALBUS which was used to make assessment of the bus service locally in Spain. From the view of Kennedy.J [8], poor quality of service stems from mainly two factors and they are: ignoring the employment of the right people and overlooking the measurement of outcomes coming from certain activities introduced in public transportation. According to Gronroos.C [9], there are important six criteria: accessibility and flexibility, reliability and trustworthiness, professionalism and skills, reputation, attitudes and behaviors, recovery.
Quality of public transport service in two Indian cities was under investigation in a research which was carried out by Randheer, AL-Motawa and Vijay [5] to know how users perceive the quality. They made use of scale in SERVQUAL by using 28 different items in six different dimensions and those dimensions are: responsiveness, reliability, assurance, empathy, cultural and tangibility. To decrease factors and find suitable dimensions, factor analysis proposed earlier was made use of. Elimination of dimension tangibility was done. From what was done, it was concluded that reliability, assurance and responsiveness were considered to be important dimensions. The research results clearly show that some of aspects mentioned in the following are considered to be important: employees who inspire the trust, services which are provided on time (arriving at destination timely), employees willingness to help passengers, convenience in operating hours (correlation with work schedule) and respect towards for everyone, especially for local values, attention to women, children and disabled people [5]. Barabino.B et al [10] made some modifications to SERVQUAL scale before using it in his own research to evaluate quality of service in urban bus transport system and in his work, on-board security, frequency, cleanliness and reliability were considered as important factors.
3 Research methodology
The primary aim of this research is to make investigation into the current public transport quality in Bukhara. The study focus was on the bus which is one of the popular means of transportation since it was subject to modernization.
What was expected from the research is given below:
A) determination of factors which can be indicators of public transport user satisfaction
B) determination of level of satisfaction of users in terms of public transportation.
C) suggestions for improvement of public transport services.
The obtained sample is consisted of students studying in four universities who use bus to commute. Since students are major commuters using public transportation system, they were in the target group in the city. When making decision on which sampling method to be used, the most convenient one was used. While getting the questionnaire, it was considered that the bus station is not the right place to ask students to fill the form and submit it for this reason, they were asked to fill the form during their presence at the university. Among students, the ones who use the bus mostly were chosen to take part in the ongoing research. Two types of research were merged together in this work which were: quantitative research for which, the survey was important and second one was qualitative research for which, the focus group is considered to be important. In the conducted research, there were three different groups, with each group including eight participants. As it was mentioned above, participants are meant to be students since majority part of student population use the bus. Depending on the results obtained from focus groups, questionnaire was prepared which is given below and the satisfaction level was ranging from one to seven, with one meaning total dissatisfaction and seven meaning total satisfaction (Table 1). Apart from the scale in this table, to evaluate the overall experience, another scale was used and gender information was also taken into account for the statistical data.
What means of transportation do you use frequently ?
☐bus ☒taxi private ☐car ☐Not public transport
On the scale ranging from one to seven, assess satisfaction level in different following aspects when using the bus in the city.
Tab. 1 Satisfaction level
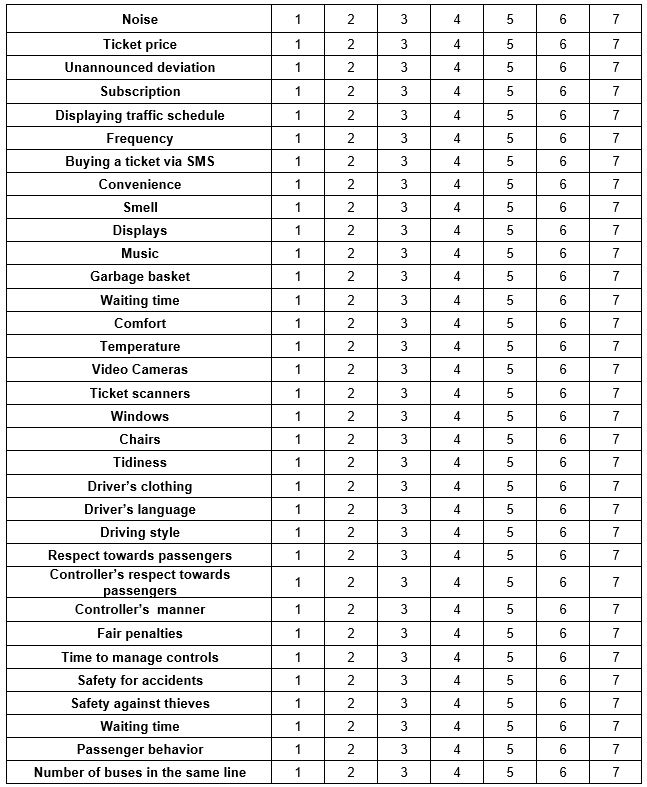
Source: own processing
Overall experience
| 1 | 2 | 3 | 4 | 5 | 6 | 7 |
Gender ☐Male ☐Female
District ______________
Income per month
☐< 500k ☐500-1000 ☐1000-1500 ☐1500-2000 ☐>2000
4 Research results
Overall, 30 subjects were tested for the questionnaire and in order to make questions more clear, some modifications have been made. Validity and accuracy of the content were checked by three professors who work at and commute to university by bus almost every day. Having analyzed the questionnaire, they said they can confirm that all the included aspects can cover all the conditions to carry out survey. Factor analysis was used to verify the construct validity, by grouping the items according to dimensions and correlations among variables. Sample structure can be seen in Table 2.
Tab. 2 Sample of research
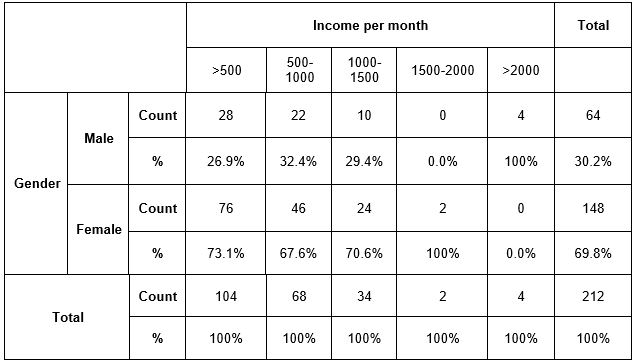
Source: own processing
To carry out factor analysis, size of the sample should be sufficient. There are some rules which are given below. According to Rule 100, the variables which are used in factor analysis should be five time smaller than the total number of participants who will act as a respondent [11]. According to Rule 150, the size of the sample should be equal to the number which is in the range from 150 to 300 [12]. According to Rule 200, the size of the sample should be no less than 200 in some cases [13]. In this study, overall 212 samples were collected from respondents which is totally appropriate size in terms of carrying out factor analysis.
Exploratory factor analysis was used in SPSS which used Principal Components Extraction Method with 33 items included. KMO test value was equal to 0.815 which, in turn, confirms that factor analysis meant for correlations among matrix is appropriate. Values of KMO which is more than 0.7 is the indication of reliable solution. Whereas, values equal to 0.6 or smaller can illustrate factors which are not appropriate [14] [15]. While some researchers highly recommend a level which is greater than 60 % [17], some researches tend to keep analysis factor around 80% in variance [16].
In all the carried out researches, the Component Matrix represents loadings of factors, with loadings which is less than 0.3 being considered weak and other ones which are in the range from 0.3 and 0.6 are considered average and finally those which are over 0.6 are regarded as strong[18]. Majority of researchers who made use of exploratory analysis did their work with 0.4 cut-off margin point[19]. In this work, it is impossible to come across values which are lower than 0.4 that’s why removal of no item is necessary. Items sharing the same loadings with more than one factor were made to disappear in Rotated Component Matrix.
The following includes the items which were removed: Video cameras, Tickets scanners, Safety for thieves during trips, Waiting time, Comfort, General tidiness, Displaying the buses traffic schedule, Penalties application fairness, Buses frequencies arrivals, Time to manage controls and Noise. After removing these factors, the new factor analysis was carried out and new six factors were identified which were more than 1 which plays important role to explain 69.71 percent in total variance. Consistency is measured internally with the help of the coefficient called Cronbach-alpha. If this coefficient is around 0.89, it is considered reliable, with the lowest value being 0.7 however, in some cases, cut-off point is 0.75 or can be 0.8[16] while other researches consider 0.5 value satisfactory[20]. From the view of George and Mallery [21], value 0.9 can be regarded as excellent in terms of reliability.
In this work, six dimensions were identified and they are: Convenience, Amenities, Drivers behavior, Controllers behavior, Price and Technology. Table 3 illustrates the used scale in the dimension called Drivers behavior in which the Cronbach-alpha coefficient value is 0.82. Initially, there were 4 items but after the removal of Other travelers’ behavior this coefficient reached to 0.85. The level of satisfaction is 3.36. Driving style is considered as a one of factors which cause dissatisfaction.
Tab. 3 Drivers behavior
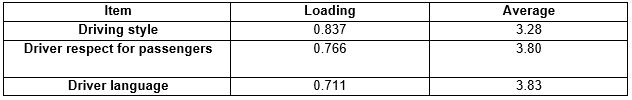
Source: own processing
Scale for the Controllers behavior can be seen in table 4 Initially, the scale had 3 items and internal consistency scale was 0.79. After the removal of Driver clothing in scale, Cronbach-alpha coefficient reached 0.9 and satisfaction level was 2.59. Students expressed their dissatisfaction about how controllers communicate with them and also they expressed disrespect of controllers.
Tab. 4 Controller behavior

Source: own processing
Amenities dimension is represented in table 5 which includes three items and scale consistency is 0.79. This scale has level of satisfaction with 3.05. People felt dissatisfied about the number of buses in the same line as well as the way the windows and chairs are organized in the bus.
Tab. 5 Amenities
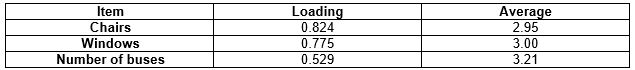
Source: own processing
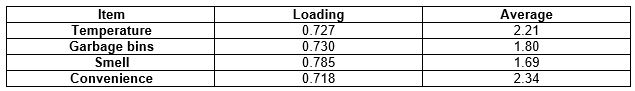
Convenience dimension is clearly illustrated in the table 6 which includes four items and consistency in this scale is 0.83 and level of satisfaction is 2.21. Passengers expressed their dissatisfaction about the conditions and comfort level.
Tab. 6 Convenience
Source: own processing
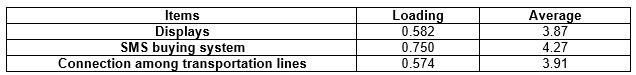
The technology dimension is given in table 7 with 4 items included in the scale initially and scale consistency is 0.58. Once the removal of uninformed deviation from scale occurred, the coefficient reached 0.65 and level of satisfaction was 4.01. They felt no satisfaction or dissatisfaction regarding technology.
Tab. 7 Technology
Source: own processing
Table 8 illustrates price dimension which has two items and consistency was 0.73, with satisfaction level being equal to 3.4. The factors that make students dissatisfied are subscriptions and prices of tickets. Even though they are offered special subscriptions, they do not seem to be enough.
Tab. 8 Price

Source: own processing
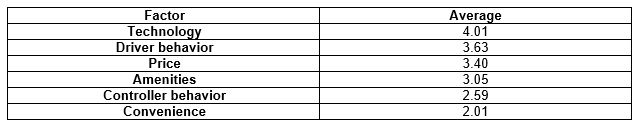
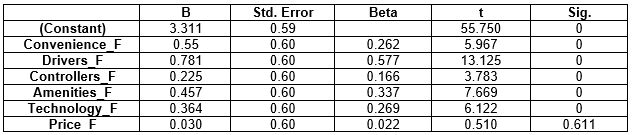
In the table 9, each factor describing satisfaction level is illustrated, with average satisfaction level being 3.31. People felt dissatisfied about the different aspects of the pubic transportation in the city and the technology is the first and convenience is the last when it comes to appreciating them. In the table 10, what is shown is coefficients which are used for regression analysis.
Tab. 9 Overall satisfaction
Source: own processing
Tab. 10 Coefficients
Source: own processing
Regression analysis was used to determine how important each factor is. With the help of the regression model, 60 percent of variables can be explained which are dependent variables. To carry out Anova analysis, sig value should be less than 0.05. According to null hypothesis, some regression coefficients which are close to zero were rejected. Variables which are independent, can explain the variation of variables which are dependent.
General degree of satisfaction is explained by the equation:
Almost all coefficients corresponding to connections, which are significant, are available for following five different dimensions: Controllers behavior (t=3.7, sig.=0.00), Amenities (t=7.66, sig.=0.00), Drivers behavior (t=13.12, sig.=0.00), Technology (t=6.1, sig=0.00) and Convenience (t=5.9, sig.=0.00).
| General satisfaction level = 3.3+ 0.78*drivers behavior +0.45*Amenities +0.36*Technology +0.35*Convenience +0.22*Controller behavior. |
Following equations helps to find the general satisfaction level.
Drivers behavior is considered as the import factor when it comes to general satisfaction. Another important factors mentioned by the young people are driving style and driver respect towards passengers because of which, passengers feel dissatisfied. Other remaining factors are as equally important as the ones mentioned above in terms of making passengers feel satisfied with public transportation quality.
5 Conclusion
There are some factors which can directly affect satisfaction level among public transport users and they are: amenities – the organization of windows and seats and functionality of them, driver behavior – how they talk with passengers, how they communicate and how polite they are, technology – availability of displays and possibility of buying the ticket by SMS system using mobile phones, controller behavior – how they respect passengers or how they communicate with students while checking the ticket and finally convenience – available conditions in the bus like air conditioner. From this research, it can be see that the students feel dissatisfaction regarding the public transport quality. Compared to other factors, only technology was found satisfactory while other remaining factors where found dissatisfactory. These obtained results can be used to improve the quality of public transportation service since it clearly indicates some of the aspects which are not appreciated much by the students who are majority part of public transport users. Findings obtained in this research can be of benefit for some administrations who are striving to improve the quality of transportation system to meet the passenger expectation.
References
- Kumarv, Kanagaluru Sai, 2012. “Expectations and Perceptions of Passengers on Service Quality with Reference to Public Transport Undertakings”. The IUP Journal of Operations Management, Vol. XI, No. 3.
- Johns. N, 1992. “Quality Management in the Hospital Industry: Part 1. Definition and specification”, International Journal of Contemporary Hospitality Management, 1.4(3), p. 14-20.
- Parasuraman.A, Berry.L.L, Zeitham.V, 1991. Refinement and reassessment of the SERVQUAL scale, Journal of Retailing, 57(3), p. 25-48.
- Ancarani.A, Capaldo.G, 2001, “Management of standardized public services: a comprehensive approach to quality assessment”. Managing Service Quality, 1(5), p. 331-341.
- Randheer.K, AL-Motawa.A, Vijay.P, 2011. “Measuring Commuters’ Perception on Service Quality Using SERVQUAL in Public Transportation”, International Journal of Marketing Studies, Vol. 3, No. I, p. 21-34.
- Edvardsson.Bo, 1998. “Causes of customer dissatisfaction — studies of public transport by the critical-incident method”, Managing Service Quality, Volume 8 – Number 3, p. 189-197 MCB University Press ISSN 0960-4529.
- Sanchez Perez, Manuel, Gazquez Abad, Juan Carlos, Marin Carrillo, Gema Maria and Raquel Sanchez Fernandez, 2007. “Effects of service quality dimensions on behavioral purchase intentions. A study in public-sector transport”, Managing Service Quality. Vol. 17 No. 2, p. 134-151.
- Kennedy.J, 2011. “Current Trends in Service Quality: A Transportation Sector Review”, Journal of Marketing Development and Competitiveness, vol. 5(6).
- Gronroos.C, 1999. “Internationalization strategies for services”, The Journal of Services Marketing, 13(4/5), p. 290 – 297.
- Barabino.B, Deiana.E and Tilocca.P, 2012. “Measuring service quality in urban bus transport: A modified SERVQUAL approach ”, International Journal of Quality and Service Sciences, 4 (3), p. 238-252.
- Hatcher, Larry, 1994, “A step-by-step approach to using the SAS system for factor analysis and structural equation modelling”, SAS Institute. Focus on the CALIS procedure.
- Hutcheson, Graeme and Sofroniou.Nick, 1999. “The multivariate social scientist: Introductory statistics using generalized linear models”, Thousand Oaks, CA: Sage Publications.
- Gorsuch.R.L, 1983 “Factor Analysis”, Hillsdale, NJ: Lawrence Erlbaum. Orig. ed. 1974.
- Pintilescu.C, 2007, “Analiza statisticd multivariata”, Iasi, Editura Universitatii Alexandru Ioan Cuza.
- Tufis.P, 2009, “Modele de ecuatii structurale cu variabile observate, suport de curs ASIS”.
- csu.edu/garson/PA765/factor.htm (Garson, 2010)
- Malhotra.N.K, 1998, “Marketing Research”, An Applied Orientation, New Jersey: Prentice Hall.
- DeCoster.J, 2004, Data Analysis in SPSS. Retrieved.
- Raubenheimer.J.E, 2004, “An item selection procedure to maximize scale reliability and validity”, South African Journal of Industrial Psychology, 30 (4), p. 59-64.
- Fogg.B.J, Marshall.J, Laraki.O, Osipovich.A, Varma.C, Fang.N, Paul.J, Rangnekar.A, Shon.J, Swani.P, Treinen.M, 2001, “What Makes Web Sites Credible? A Report on a Large Quantitative Study”, CHI, Volume No. 3, Issue No. 1
- George.D, Mallery.P, 2003, “SPSS for Windows step by step: A simple guide and reference”, 11.0 update (4th edition). Boston: Allyn & Bac
Autori:
Erkin FARMANOV1, Javlon TURSUNOV2
Tituly a pôsobisko autorov:
1Erkin Farmanov, PhD student, Faculty of Economics and Tourism, Bukhara State University, M.Ikbol 11, 200 100, Bukhara, Uzbekistan E-mail:e.a.farmanov@mail.uz
2Javlon Tursunov, 1st year Master’s student, Faculty of Software Engineering, Tashkent University of Information Technologies named after Muhammad al-Khwarizmi, Amir Temur Avenue 108, 100200, Tashkent, Uzbekistan E-mail:javlontursunov0817@gmail.com
